 I’ve recently come to love (read:be obsessed with) windowing functions in my coding. They’re just so useful and practical.
For those who haven’t experienced the joys of windowing, here’s the deal. They allow you to do calculations across multiple rows without actually having to group, thereby storing aggregate info on each record. That means you keep all the data associated with the row and can add calculated fields that rely on interaction with other rows. Pretty swiffy, huh?
Below are just a few funky functions that I’ve found helpful. I’m not saying that these aren’t resource intensive, but they may just save you from having to join to some crazy aggregation sub-queries and then export to Excel for further manipulation to get the same result. Continue reading

 Imagine, if you will, begin able to calculate the time between visits to a website, transactions in a store, logs from a punch-clock, etc. in just one step. Well, I have found the way!
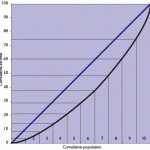
 Slicing data into manageable chunks for viewing is crucial when you start dealing with more records than will fit in something like Excel (without PowerPivot, of course). One of the most common ways to look at data in a more easily-digestible manner is to use percentiles, or some derivative thereof, to group records based on a ranking. This allows you to then compare equal-sized groups to one another in order to form conclusions as to relative behavior.