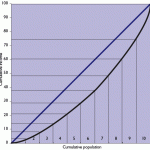
 Slicing data into manageable chunks for viewing is crucial when you start dealing with more records than will fit in something like Excel (without PowerPivot, of course). One of the most common ways to look at data in a more easily-digestible manner is to use percentiles, or some derivative thereof, to group records based on a ranking. This allows you to then compare equal-sized groups to one another in order to form conclusions as to relative behavior.
Most SQL variants have workarounds for how to accomplish this task that may or may not actually cover 100% of your data (may drop a few records here or there when trying to round a percentage to a whole number of records to pull). PostgreSQL, on the other hand, has a handy function built in for doing this sort of thing without having to worry about getting full coverage on your table. Continue reading

 Recently, in speaking with the President of Kobie regarding my team, I used the term “data munging” to describe a lot of the work that we do. He laughed, thinking I had said “data munching” (mmmm, tasty!) and asked if that was a technical term. The short answer is that yes, it is another term for data wrangling (which, incidentally, is one of my favorite terms in the industry).